A bit of context…
What is the Cold Spot?
The Cold Spot is a feature of the Cosmic Microwave Background (CMB for short) which is the oldest light in the Universe. After the Big Bang the Universe was very hot, dense and opaque. It was only around 380,000 years after the Big Bang, at the epoch of recombination (when protons and electrons combined to form hydrogen), that the Universe finally became transparent and light trapped between these charged particles could finally escape.
These photons have been travelling in the Universe for billions of years and have been redshifted into the microwave part of the spectrum. With precision equipment this background radiation can be measured. Below is a map of the CMB measured by the Planck satellite. The CMB is actually extraordinarily uniform, the mean temperature of the radiation is just ~2.73 Kelvin with deviations from the mean (which is what this image shows) about ![]() Kelvin.
Kelvin.
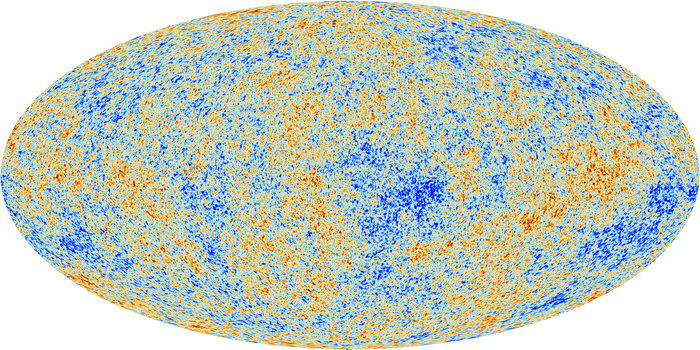
The temperature variations come from differences in density. Bluer (colder) regions are associated with higher densities. Photons escaping these over densities lose energy escaping the gravitational potential and thus appear colder. The reverse happens in under densities and this is the reason we see these hot and blue patches (this effect is known as the Sachs-Wolfe effect).
The Cold Spot anomaly was initially discovered by applying a filtering technique (Spherical Mexican Hat Wavelet — SMHW) which was designed to enhance non-gaussian features (see this paper).
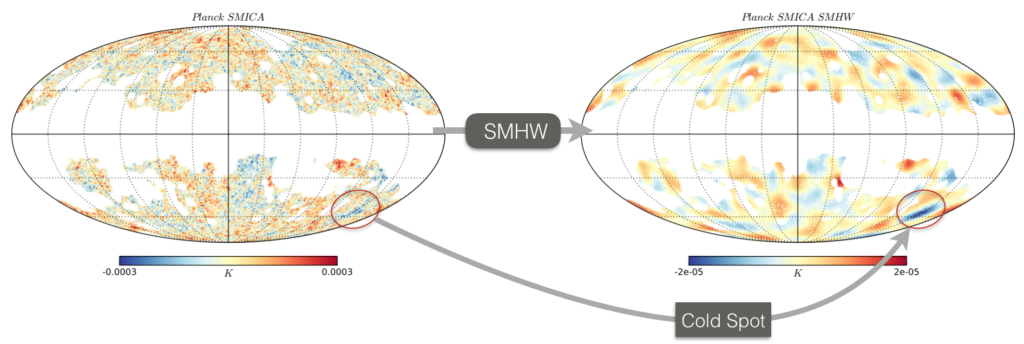
When this was performed on the CMB map measured by WMAP they found a prominent feature which is now known as the Cold Spot. Many papers have tried to explain this feature but for at least ten years there was no real evidence to suggest what was actually causing it, if anything.
The void explanation
A rather simple explanation for the Cold Spot (simple in the sense that it does not invoke new physics) was that it was the imprint of a large void (see this paper). As photons travelled through the universe they would travel in and out of potential wells, if these potentials did not evolve the photons would gain just as much energy falling in the well as they would lose coming out of it and as such the photon’s energy would be conserved. However our Universe is currently expanding due to dark energy, so potential wells actually decay over time. As photon’s fall into a gravitational well it gains more energy than it loses, thus appearing hotter and vice versa for a void. This effect is know as the Integrated Sachs-Wolfe (ISW) and was proposed as an explanation for the Cold Spot. The only problem was that the size of the void would need to be extremely large and quite empty. Such a void would be surprising in itself and many have argued it would present a bigger problem to our current understanding of the Universe than the Cold Spot itself!
Discovery of the Eridanus Void
The discovery of the Eridanus void (see this paper) in the same direction of the Cold Spot sparked a few papers on the subject. After some back and forth it was realised that the void that was found, although very large, could not explain the entire temperature profile of the Cold Spot — it was both too shallow and wide (see this paper). Furthermore if we compared the Cold Spot to the coldest spots in simulations, it was significant at the ![]() — far too low to be considered a major anomaly.
— far too low to be considered a major anomaly.
Paper 1: Could multiple voids explain the Cold Spot anomaly?
It was established that no single void could explain the Cold Spot (see this paper) but the Universe is clumpy and exhibits a rich cosmic web structure. What if there were more than one void in the direction of the Cold Spot? This is the question I was posed in my Master’s project and which was later summarised in our first paper on the subject.
We initially began by asking ourselves, well if one Eridanus void could not explain the feature, how many would we need? We did this by simply stacking the Voids along the line-of-sight but as we did this, we were adding voids which were further and further in redshift. This meant the ISW effect was getting smaller and smaller, as the effect occurs mostly due to dark energy which is strongest at low redshift. What we found was that even if we stacked voids right to the absolute edge of the observable Universe we would not be able to explain the Cold Spot.
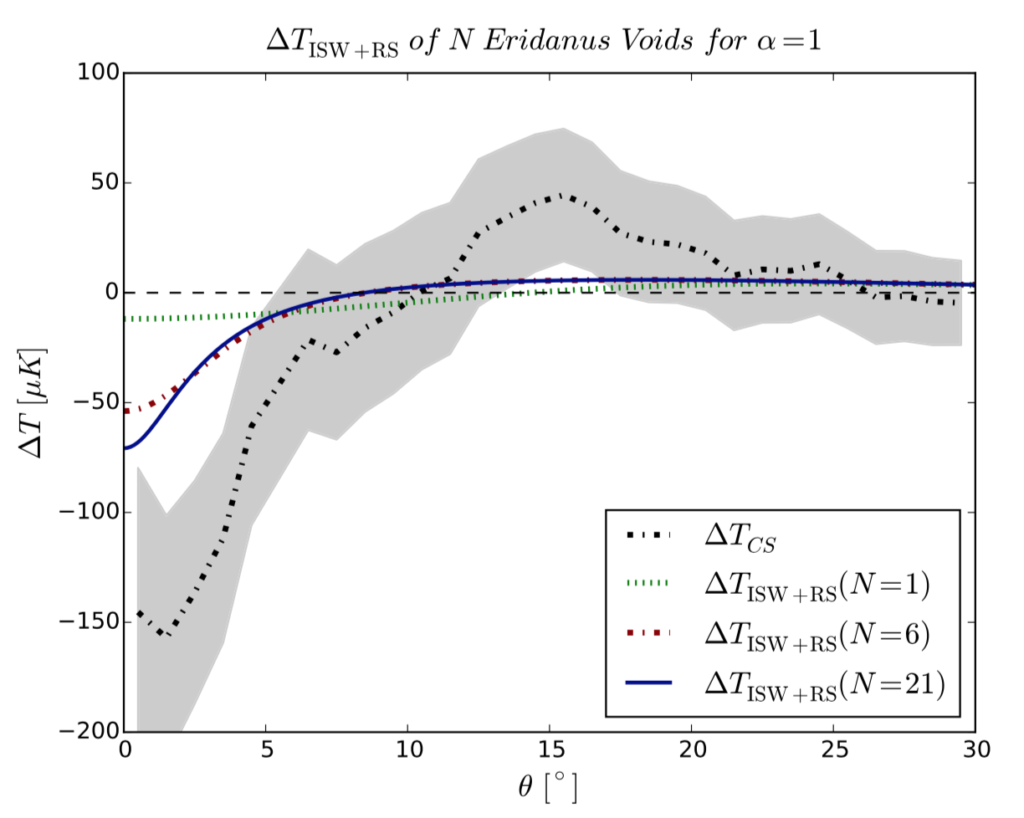
This particular scenario was rather extreme and showed that even multiple voids could never explain the entire feature. Later in the same paper we tried to come up with a more reasonable scenario. Here we placed 10 and 20 voids, measured from data release 7 of the Sloan Digital Sky Survey, between redshift 0.1 and 2 and ran these iteratively 1000 times.
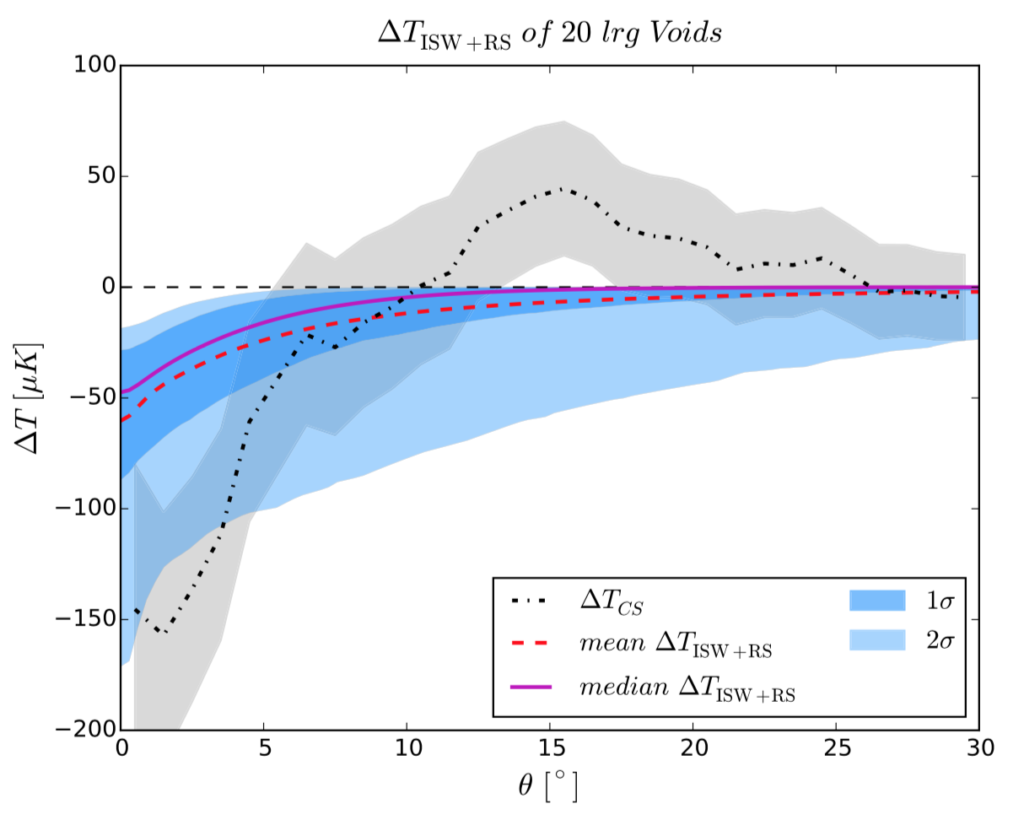
Similarly as before the profiles were rarely as strong as the Cold Spot and when they were they were far too wide. This lead to the final part of our paper, which was to ask, how much of the Cold Spot actually needed to be explained? We determined that to make the Cold Spot consistent with what we would expect we would only need to explain ![]() to reduce it to
to reduce it to ![]() or
or ![]() to reduce it to
to reduce it to ![]() . Such a profile was well within what we could expect from the ISW of a single or multiple voids.
. Such a profile was well within what we could expect from the ISW of a single or multiple voids.
This paper turned out to be somewhat prophetic as it was later determined that the Eridanus void was actually 3 or 4 voids (see this paper) and as we had established in this paper, the voids found could not explain the full Cold Spot temperature profile.
Paper 2: Sky masking and the expected ISW contribution
Previous work looking at the impact of voids on the Cold Spot had done so by assuming a void density profile. These models were very neat — they assumed spherical (or in some cases elliptical) void profiles which were smooth. In reality the Universe is not that clean, it’s much more messy so we wanted to move away from this idealistic toy model approach to a more realistic simulation of the ISW. So we instead simulated CMB maps and ISW maps separately using angular power spectra (I will skip over the details of exactly how this is done) and then measured the coldest spots in our simulations.
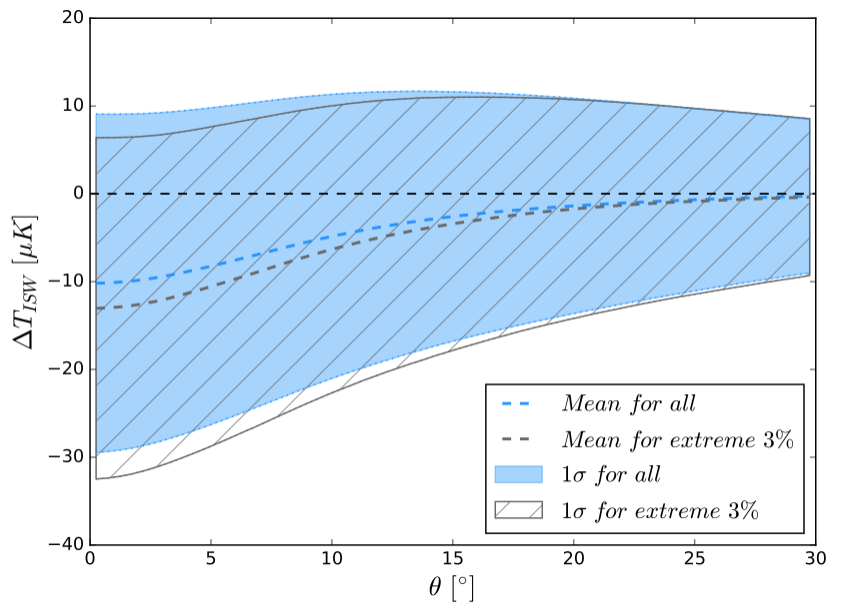
What we found was that the ISW in the direction of the coldest spot tended to be negative. On average it contributed to about ~10% of the overall profile. This meant the coldest spots on the CMB were correlated with an under density in that direction. So the fact that we were seeing voids in the line-of-sight of the Cold Spot was exactly what we should expect! Furthermore the ISW predicted from the voids found was completely consistent with what we saw in our simulations.
The next thing we looked at was the effect of a mask on the measured significance of the Cold Spot. Unfortunately we do not have an unobstructed view of the CMB, since there are a lot of things that can contaminate (mostly the milky way). Unfortunately the SMHW used to find the Cold Spot requires a more aggressive mask as the filter integrates over the sky. This means we are left with approximately half of the sky to look for Cold Spot features.

To determine the significance of the Cold Spot we compare to simulations. But because we also use a mask in the simulations, we occasionally misidentify the true coldest spot as it is somewhere hidden behind the mask. This leads to a bias as we are now comparing the Cold Spot to a sample of coldest spots that are not all THE coldest spot.
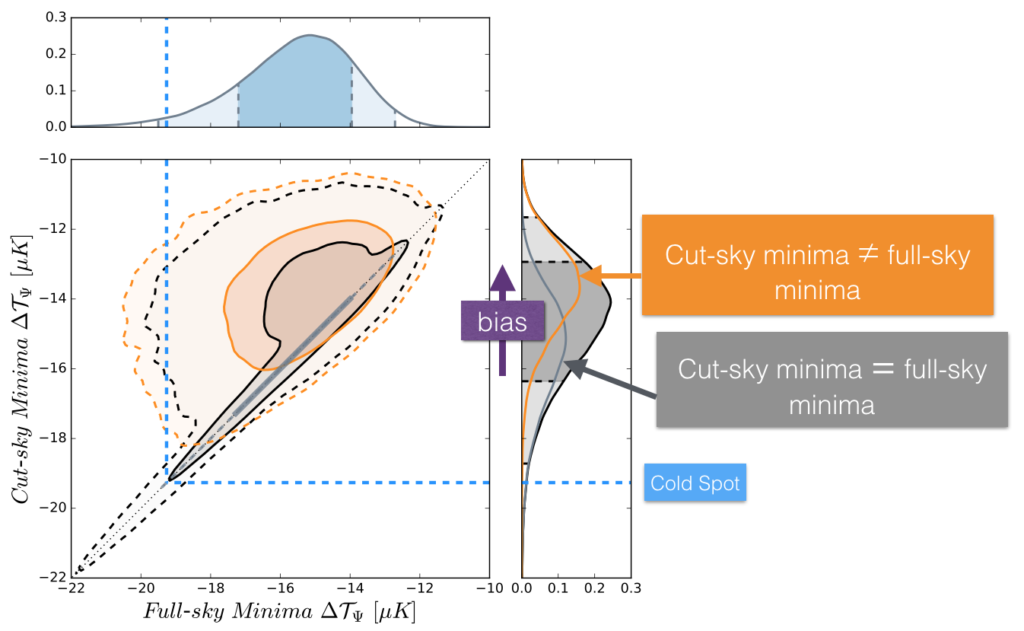
This effect becomes more pronounced as the size of the mask increases and we found that some CMB maps made with alternative methods and with smaller masks found the Cold Spot to be significant to less than ![]() . Therefore if the Cold Spot is the coldest spot on the CMB (which we estimated to be 95% likely) then it is completely consistent with the coldest spots in simulations!
. Therefore if the Cold Spot is the coldest spot on the CMB (which we estimated to be 95% likely) then it is completely consistent with the coldest spots in simulations!